Basic Usage
usage.RmdPalettes
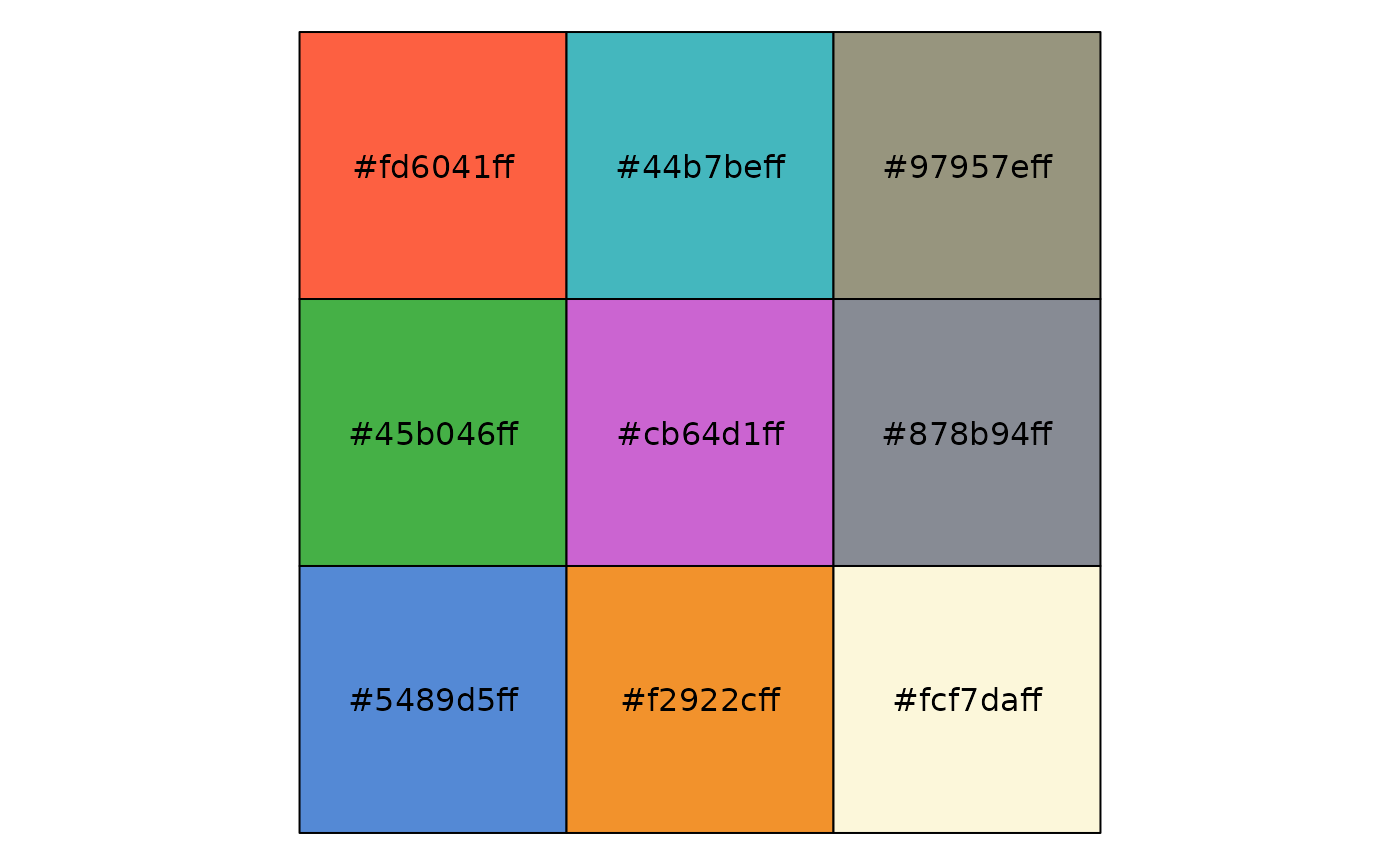
At its core, jonohey is about color palettes. You can
display the palettes using the helper function
jonohey_show()
library(jonohey)
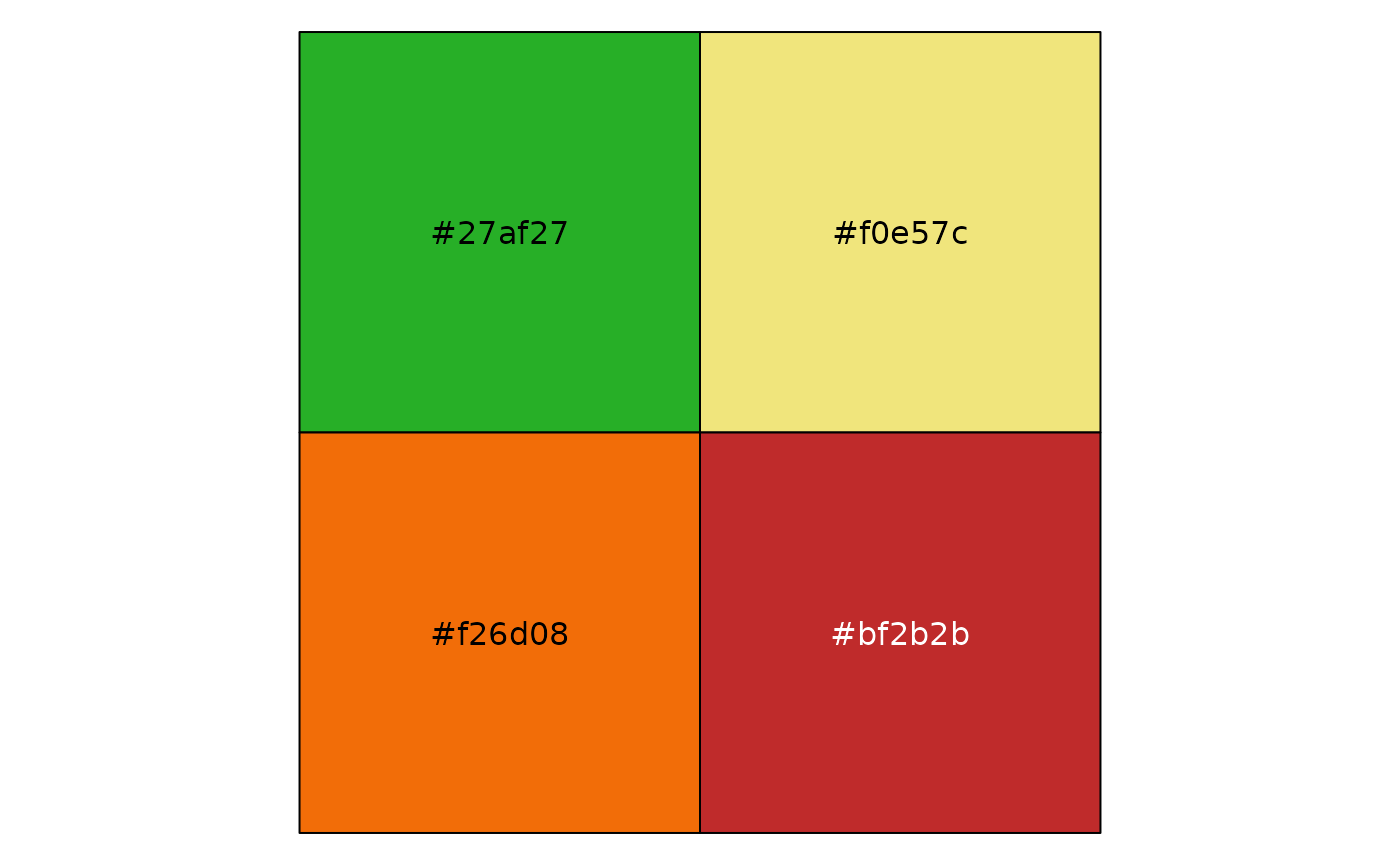
# show_col
jonohey_show("autumn")
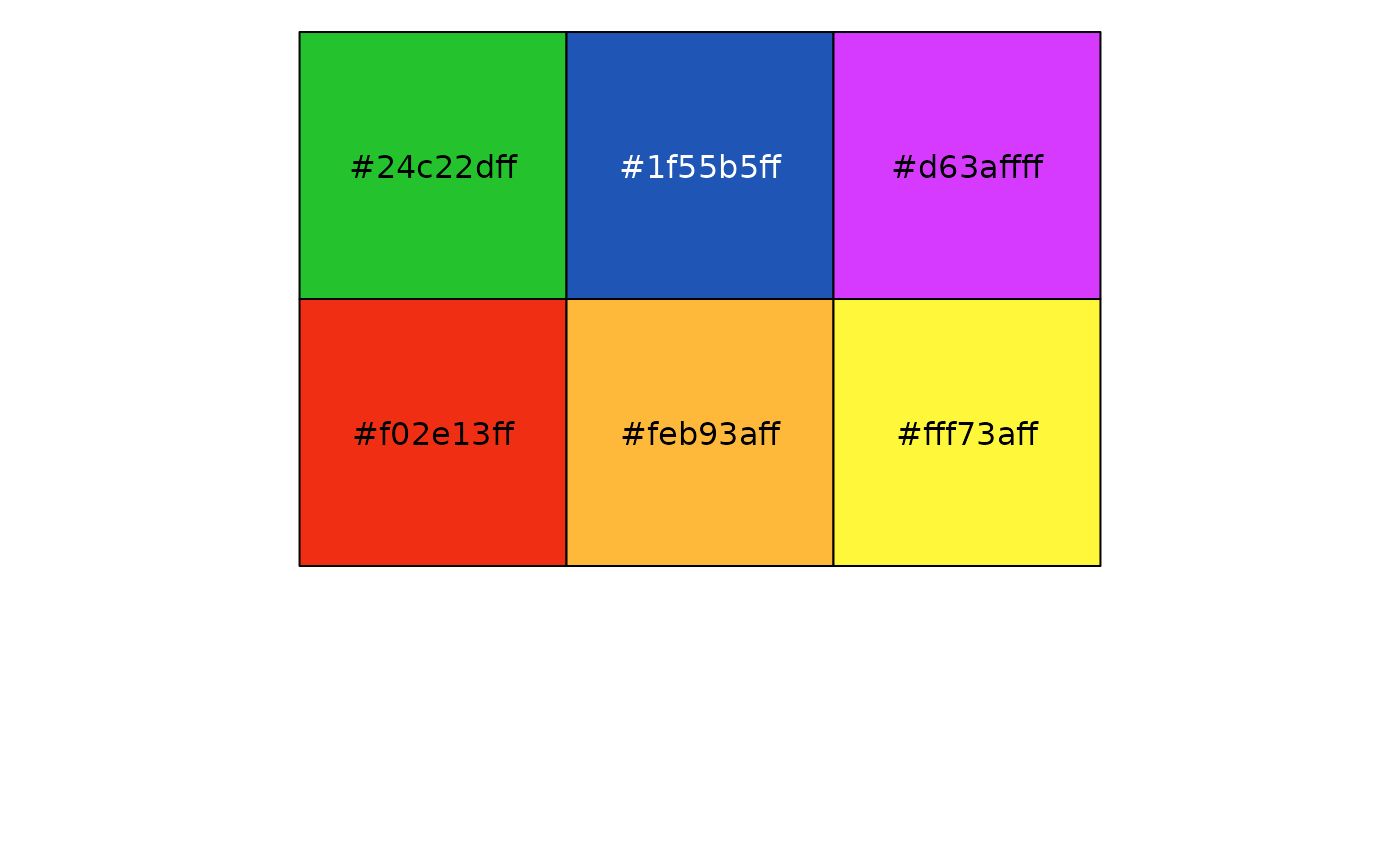
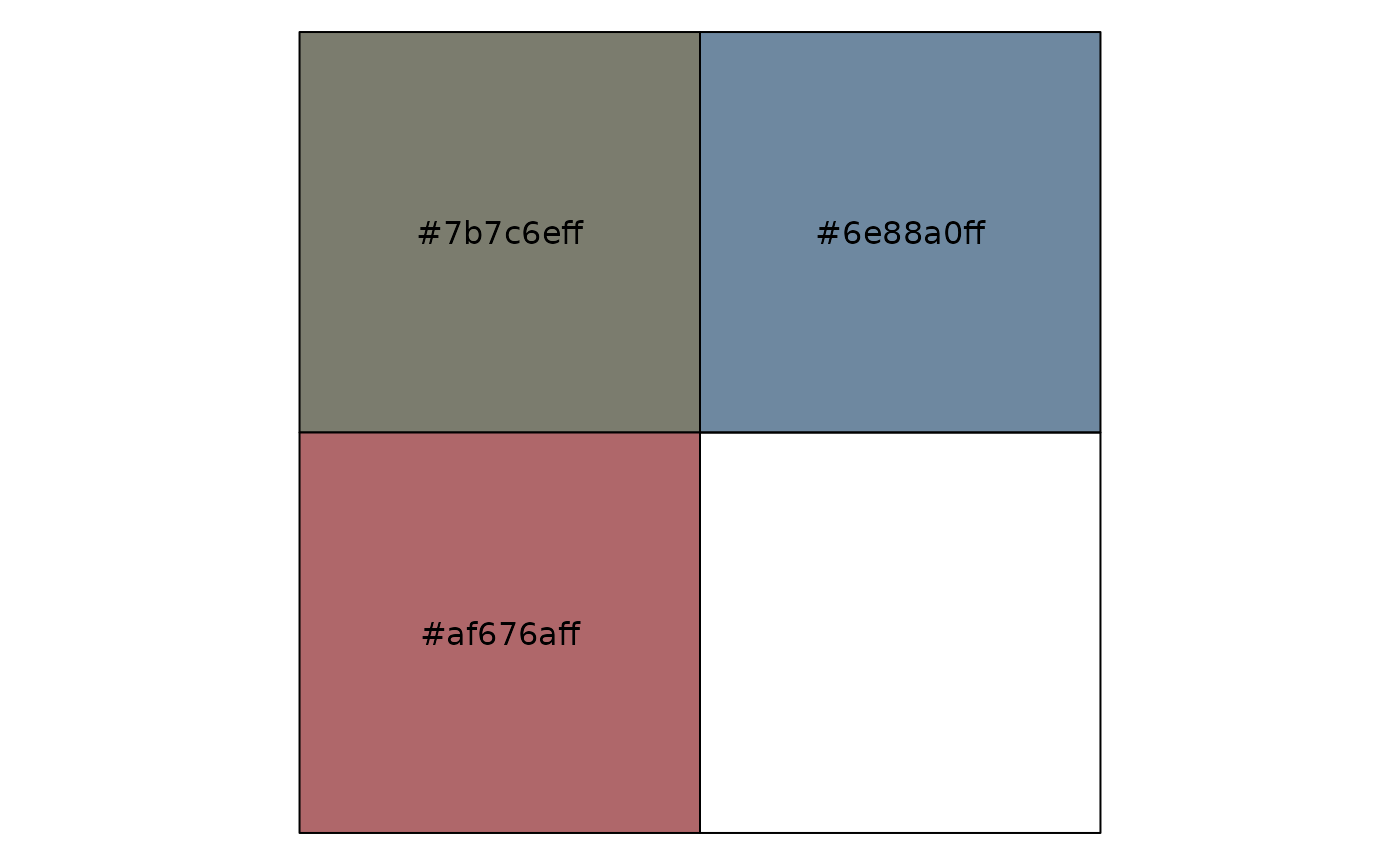
Here’s another example:
jonohey_show("flying_fabric")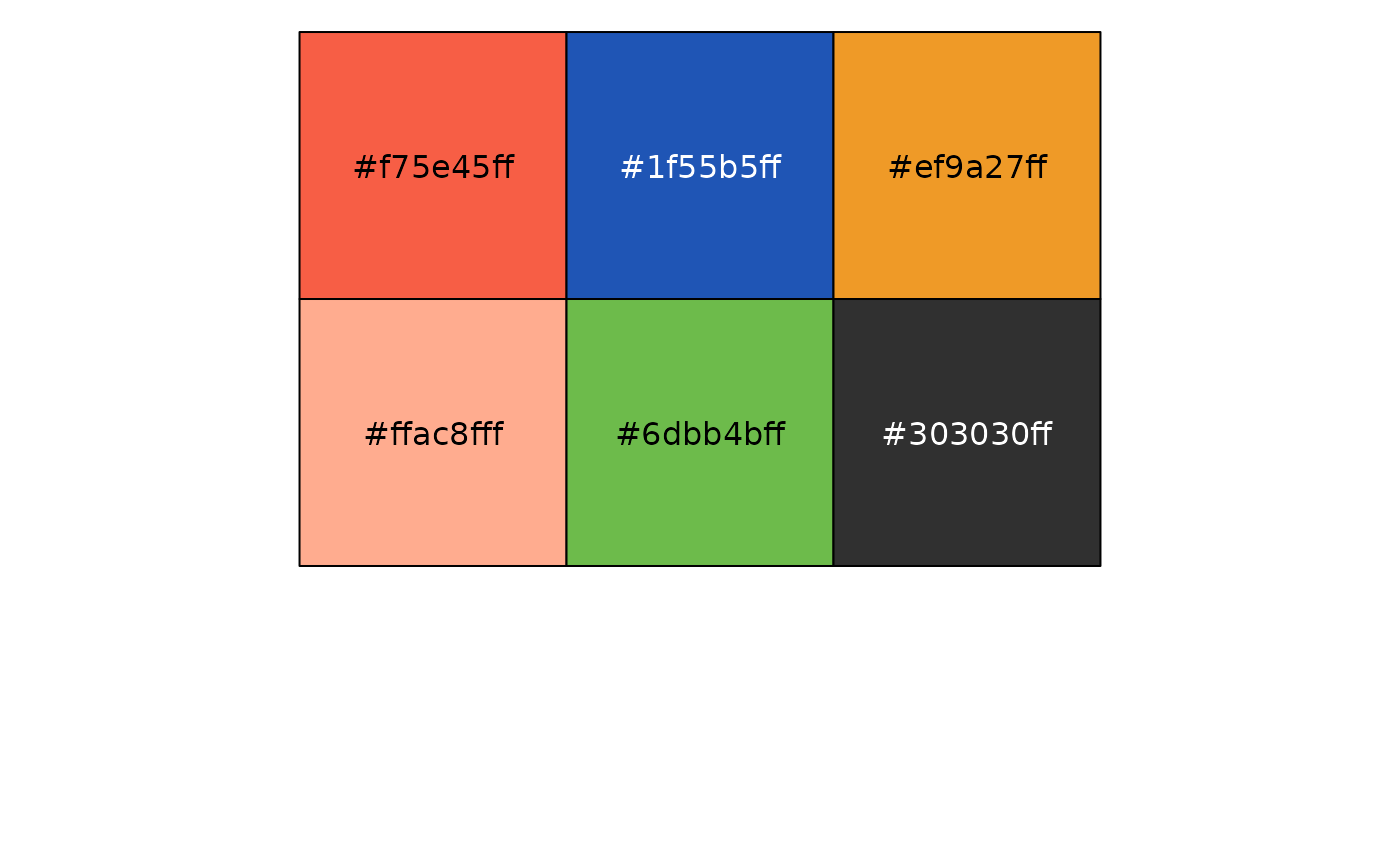
All palettes
Here are all available palettes by name.
jonohey_palettes()
#> [1] "bg_col" "jonored" "autumn" "color_wheel"
#> [5] "dark" "flying_fabric" "landlocked" "light"
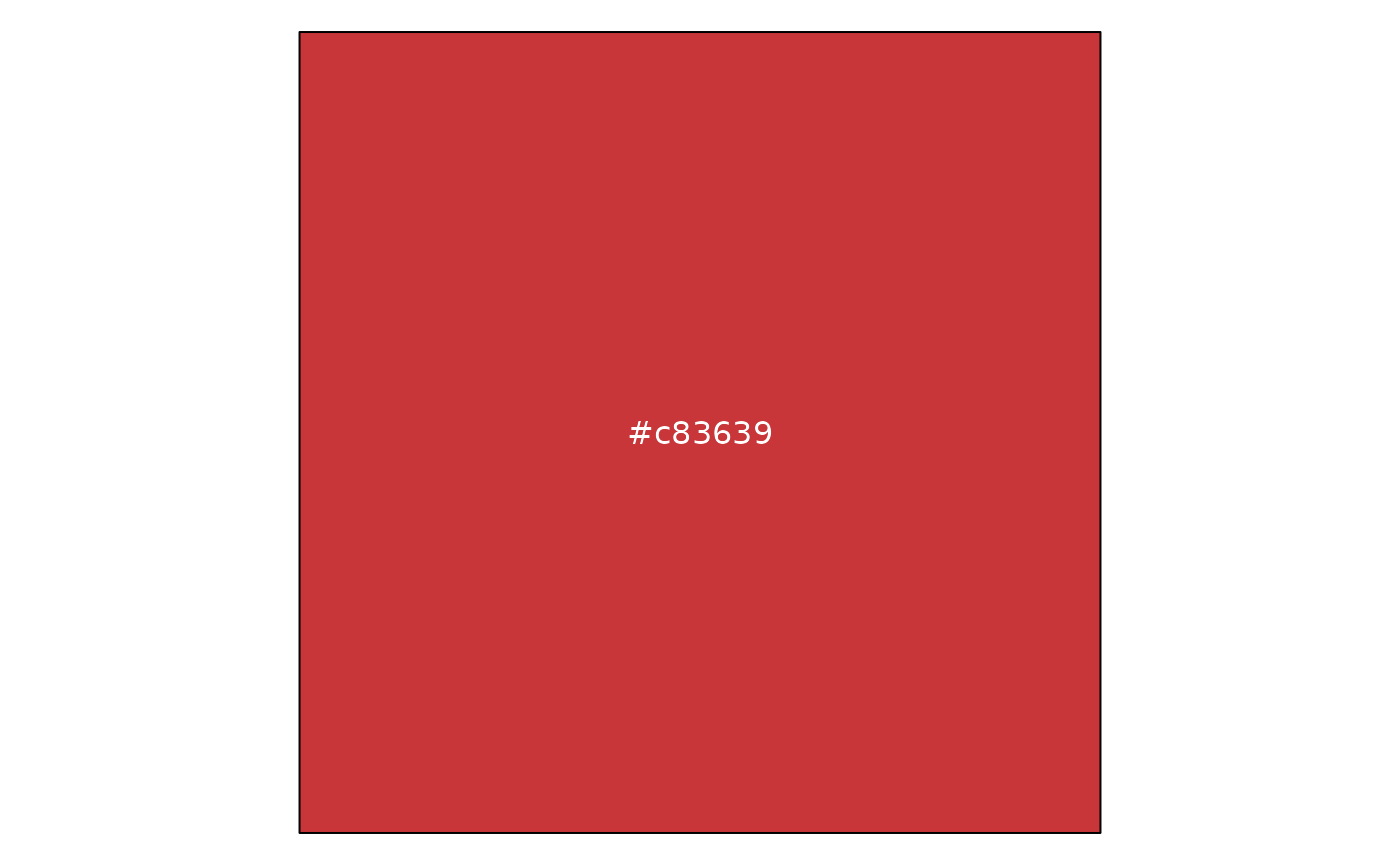
#> [9] "suit" "surfing"Notice that as of this version, we store two single colors in palettes for convenience. One of them is the background for the theme. The other one is the ba. It’s likely that these colors will be internalized in the future
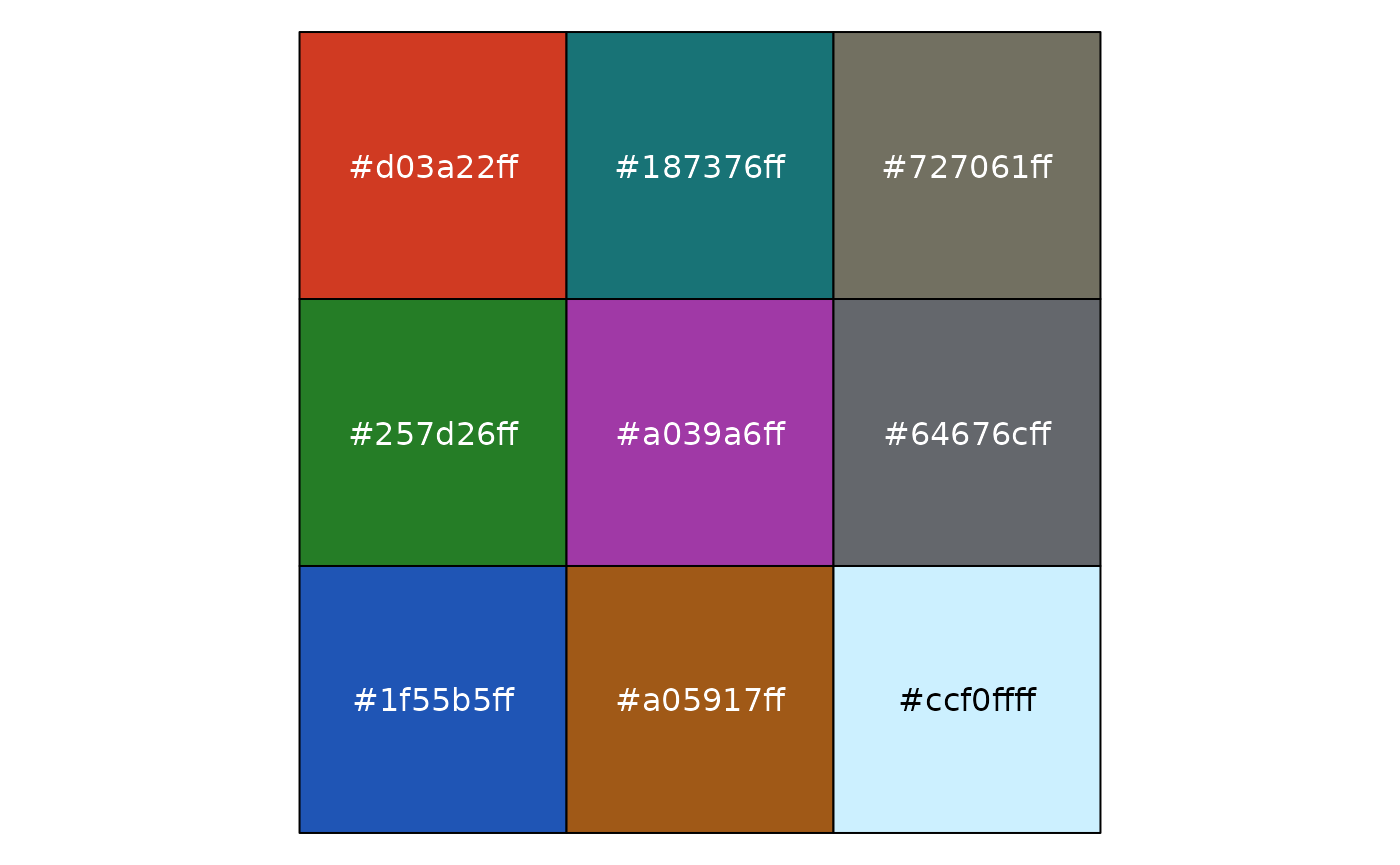
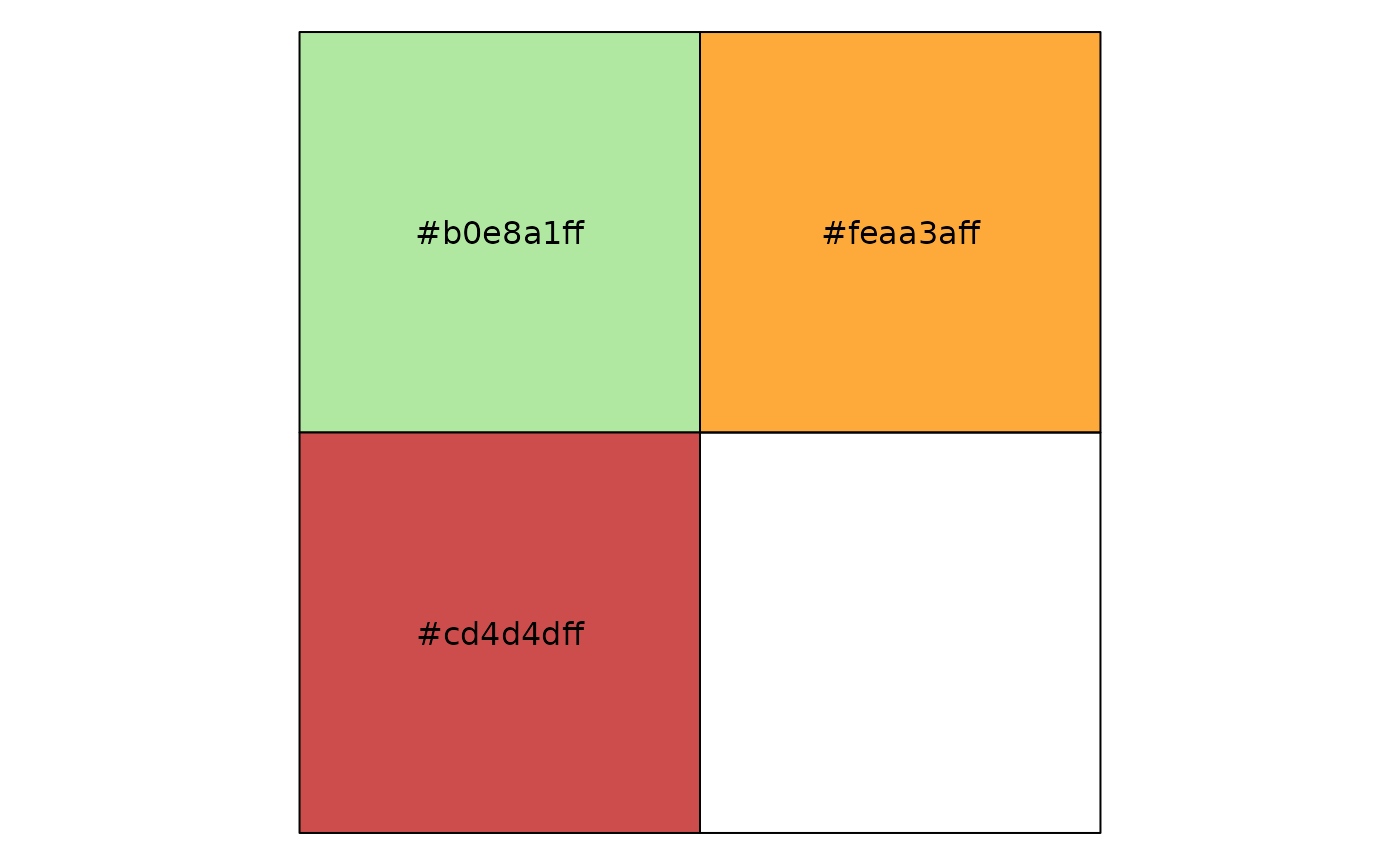
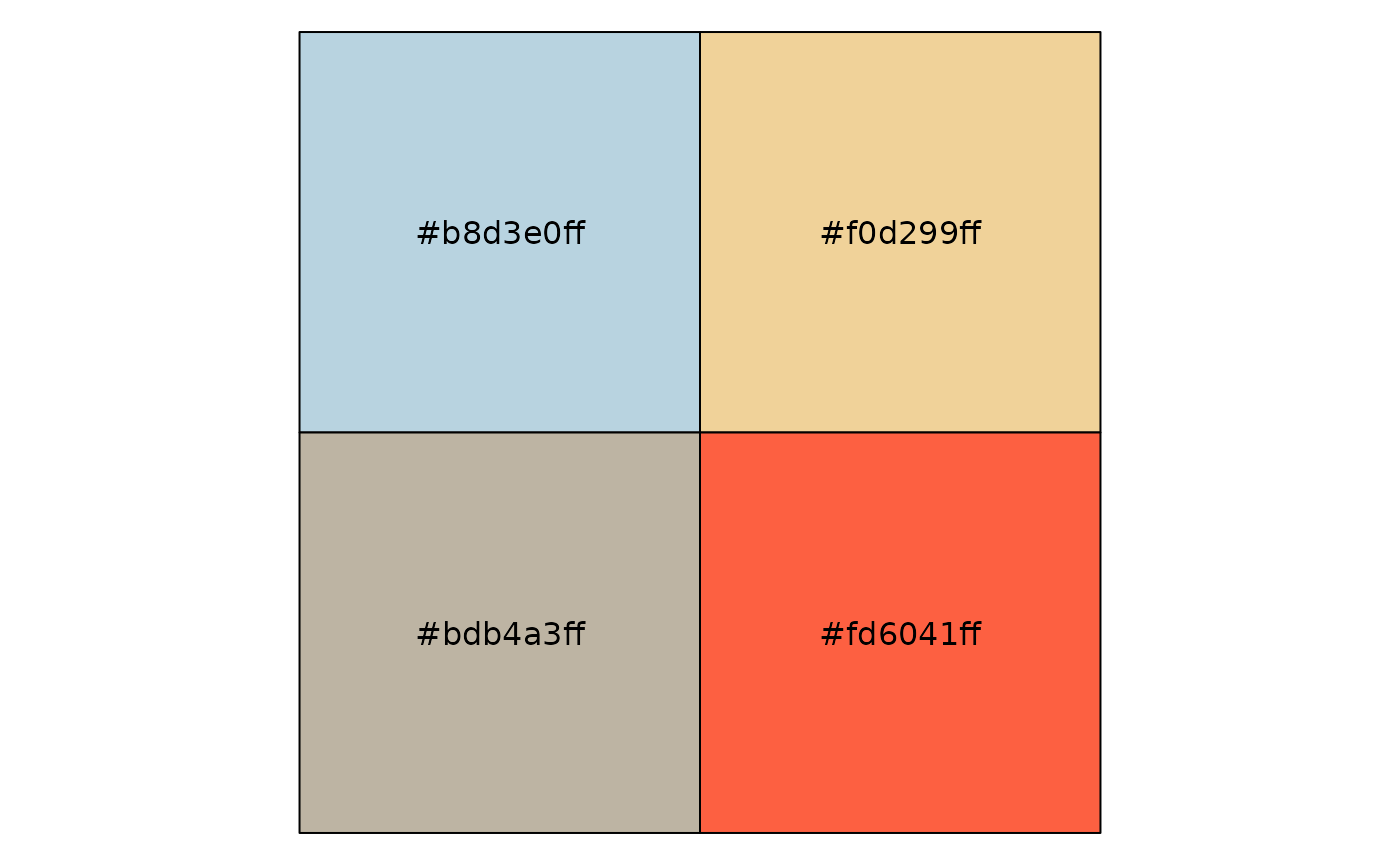
Take a look at all palettes in full color :)
invisible(lapply(jonohey_palettes(), jonohey_show))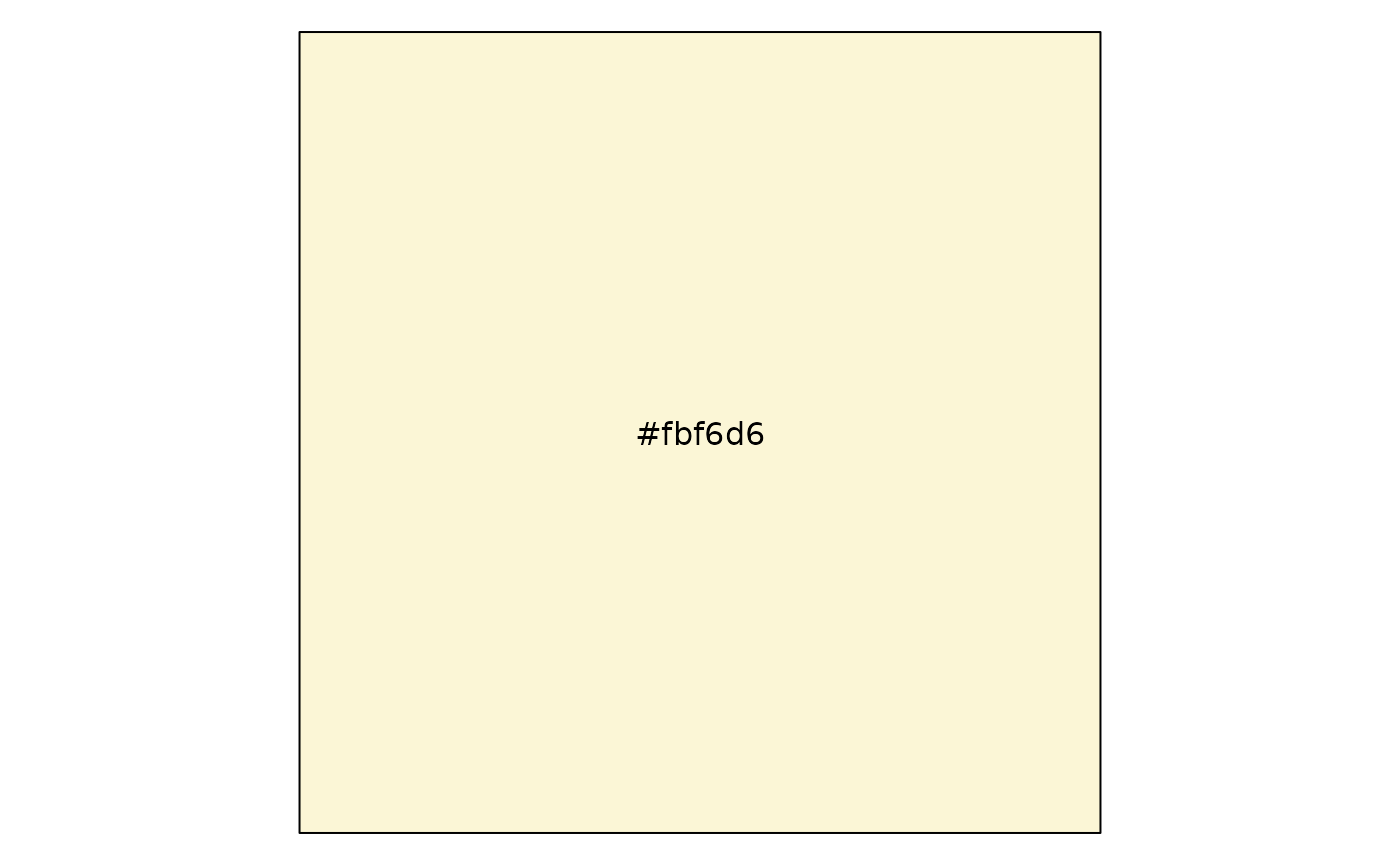

Applying palettes
We provide scale_fill_jonohey() and
scale_color_jonohey() to be able to integrate this package
into ggplot2. Here’s an example
# discrete
library(ggplot2)
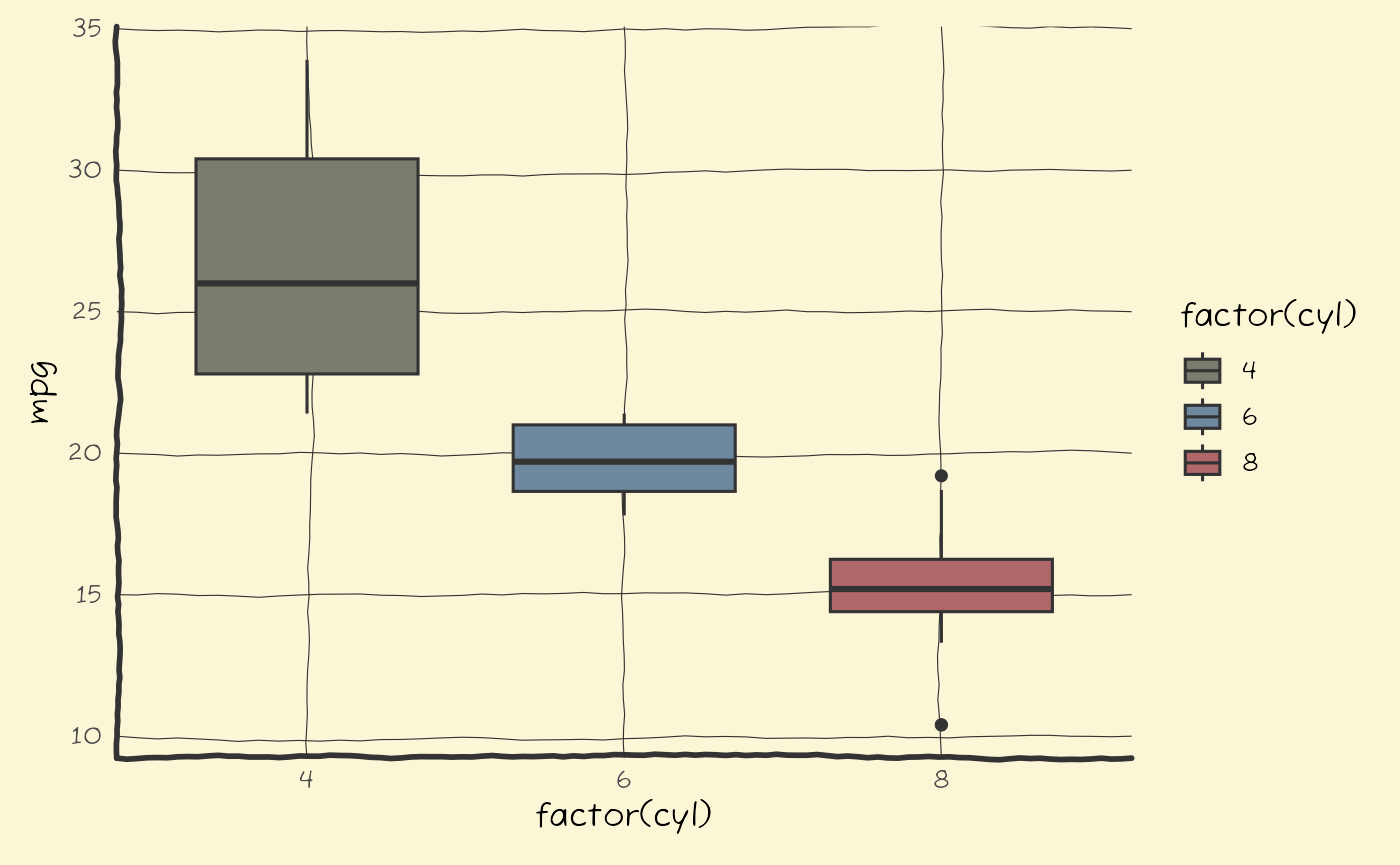
ggplot(mtcars, aes(factor(cyl), mpg, fill = factor(cyl))) +
geom_boxplot() +
scale_fill_jonohey("suit")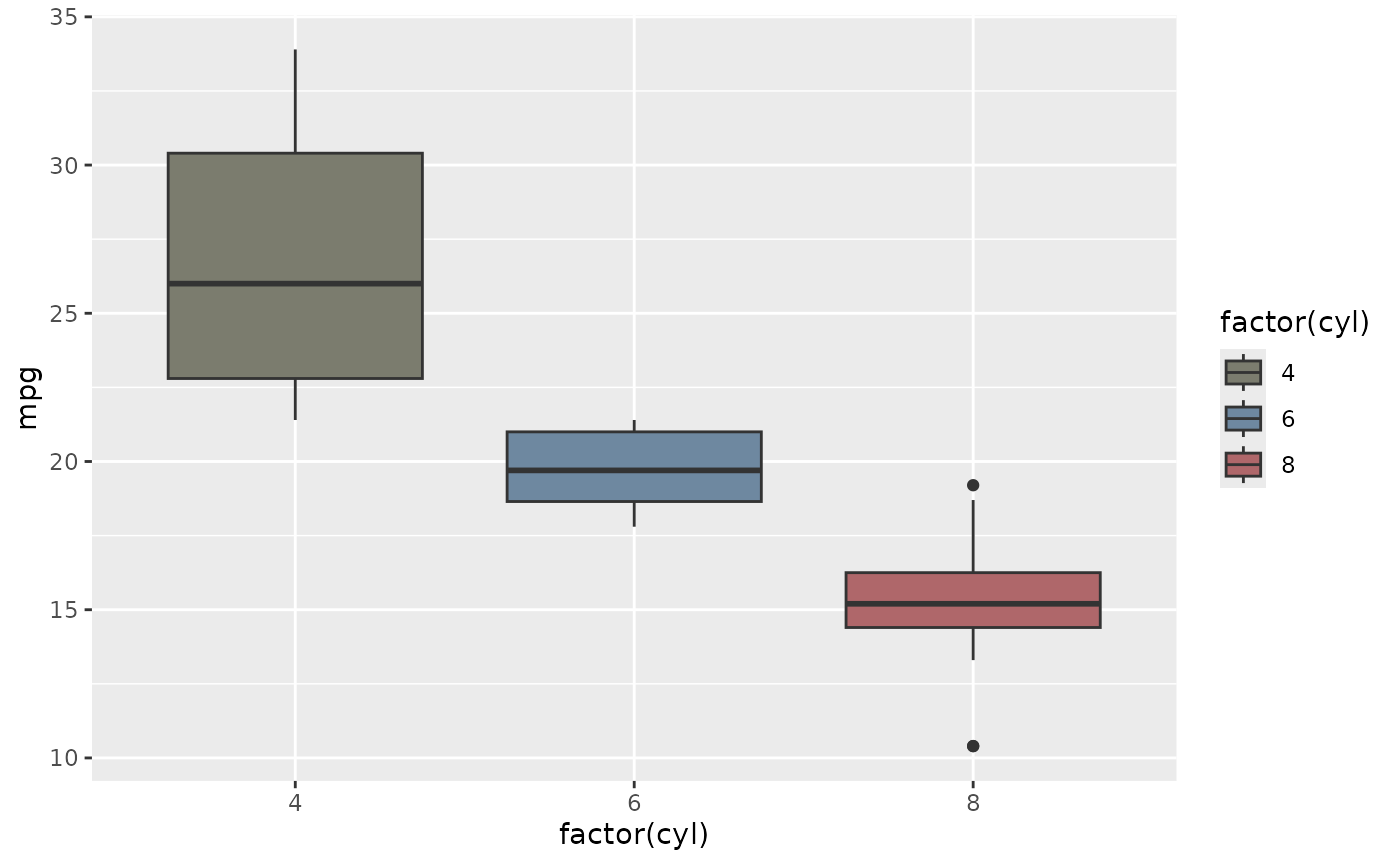
In principle, one could use these palettes for continuous mapping too. You are advised against doing so, but nobody is really stopping you right now.
# continuous example
# DEMO ONLY
# Probably not the best color choice!!!!
ggplot(faithfuld, aes(eruptions, waiting, fill = density)) +
  geom_raster() +
  scale_fill_jonohey("surfing", discrete = FALSE)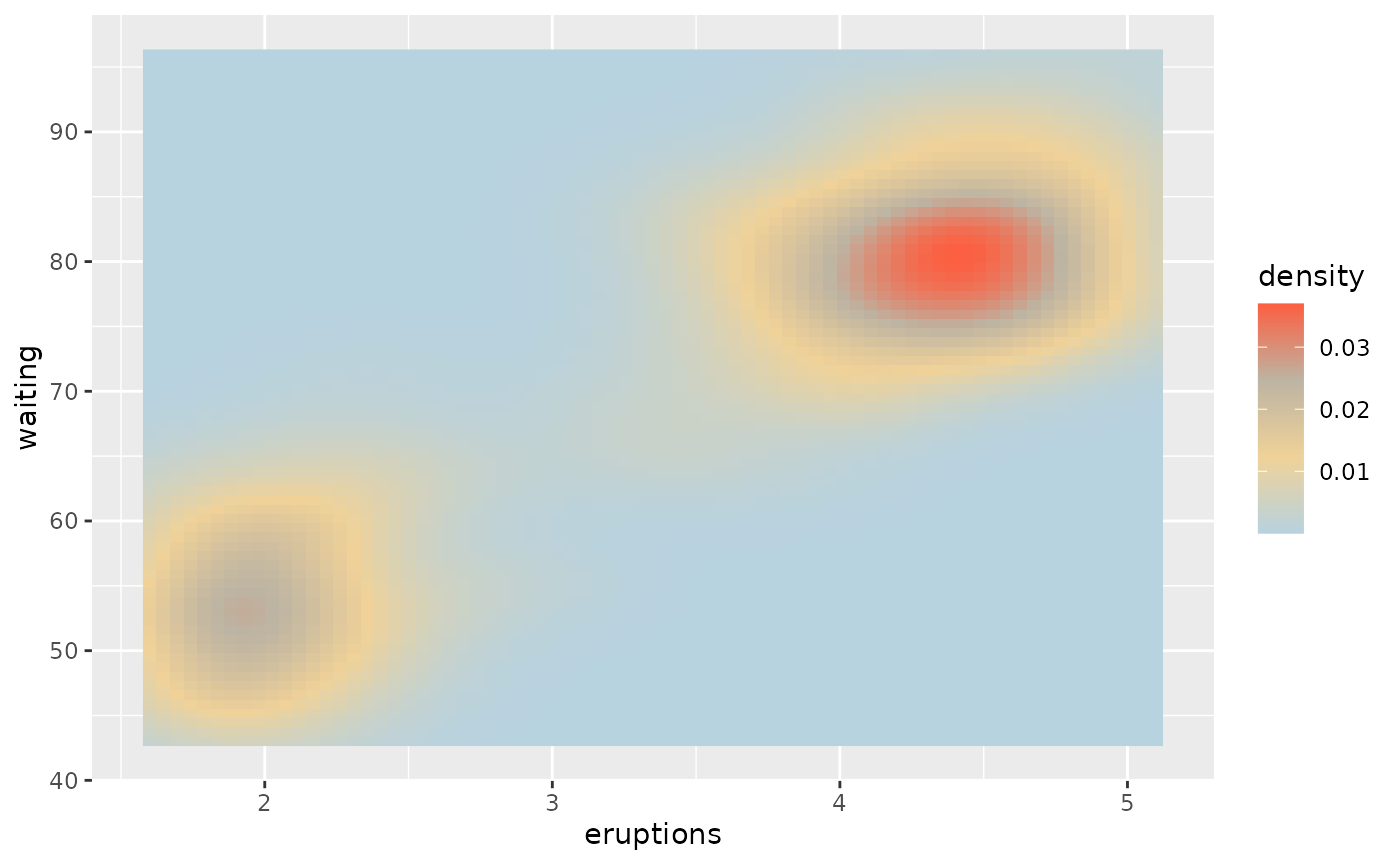
Using the theme
We provide two different themes:
-
theme_card()will give you a nice round edge around the plot panel or/and plot background
p <- ggplot(mtcars, aes(factor(cyl), mpg, fill = factor(cyl))) +
  geom_boxplot(width = 0.7) +
  scale_fill_jonohey("suit")

# round panel and plot
p + theme_card(round_plot = TRUE, radius_plot = 50)
To better understand the functioning of this theme, here are some examples:
# Rounded panel only
p + theme_card(radius_panel = 20)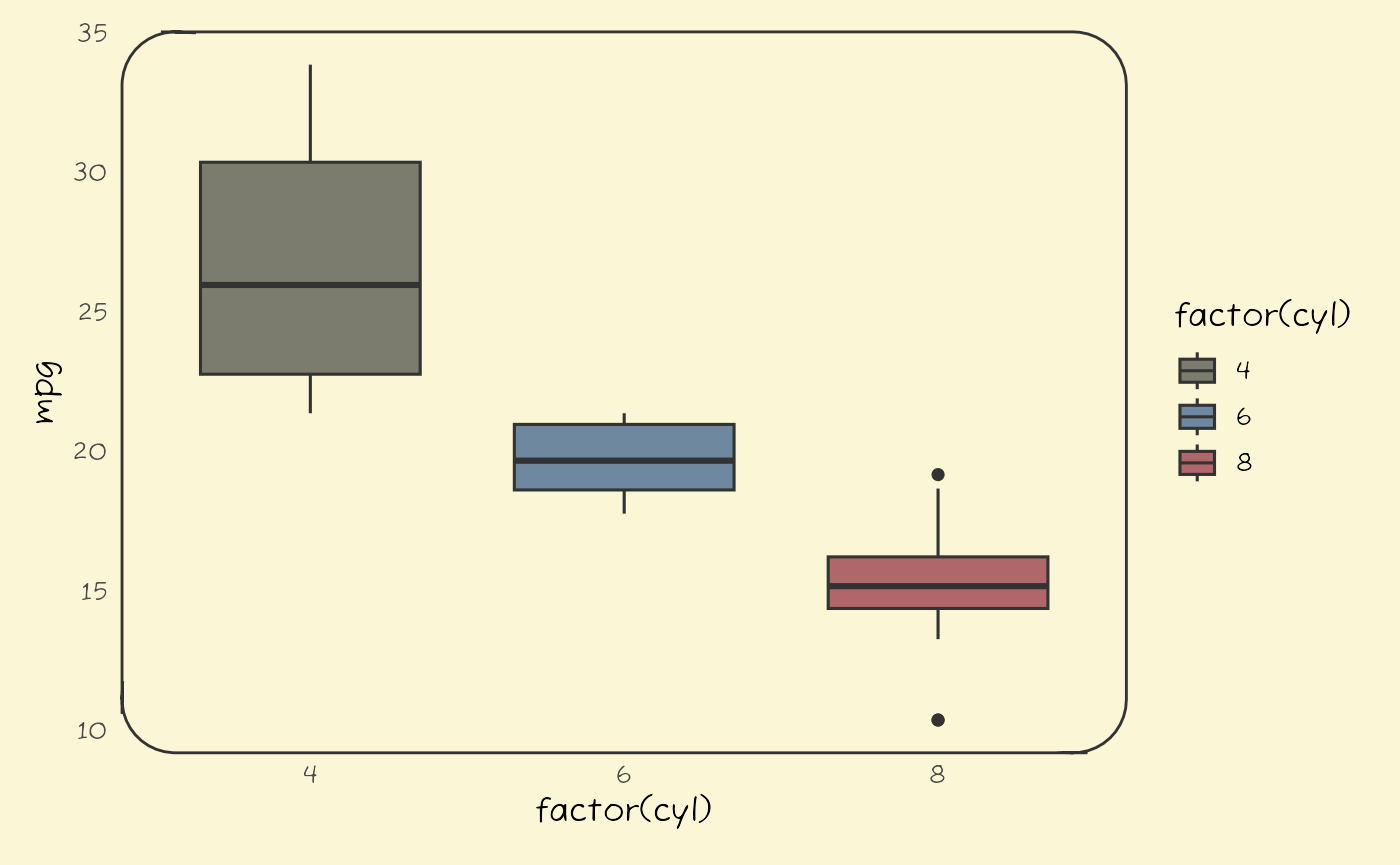
# plot not rounded, fill with gray50
p + theme_card(radius_panel = 20, plot_bg_fill = "gray50")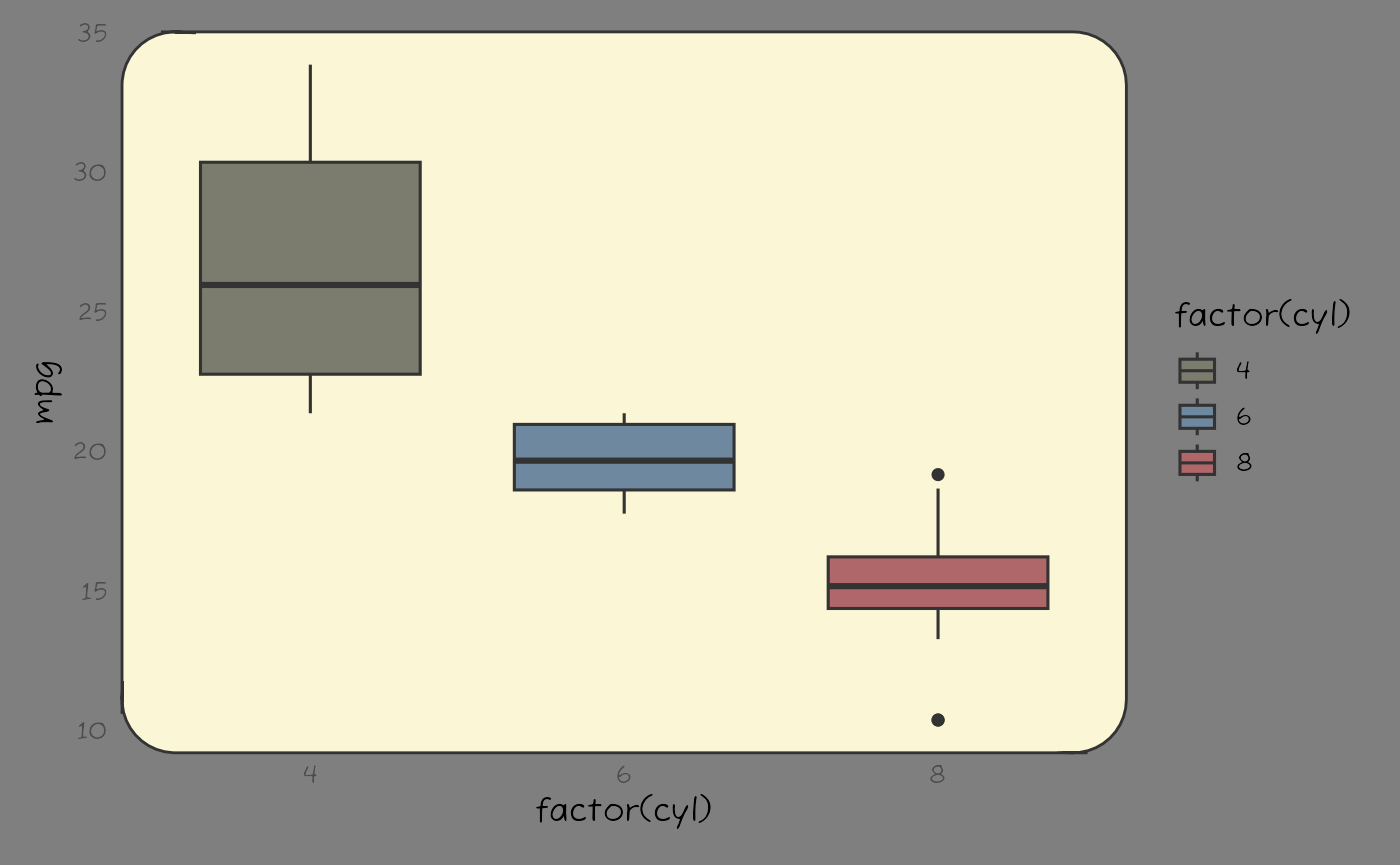
# Rounded plot background and rounded panel
# increased rounding for both
p + theme_card(radius_panel = 30, round_plot = TRUE, radius_plot = 70,
               plot_bg_fill = "gray50")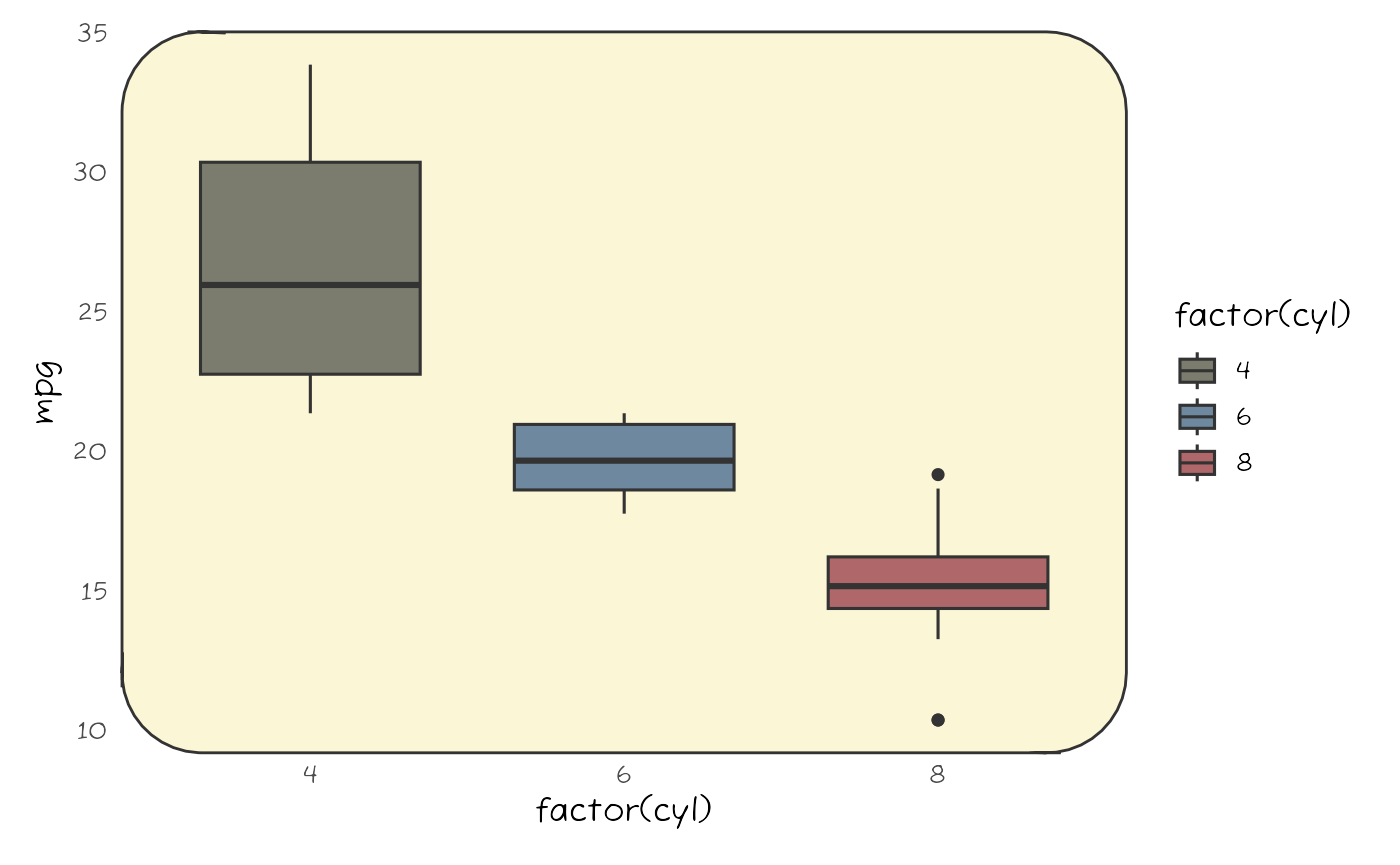
# Transparent outer card, rounded inner panel
p + theme_card(radius_panel = 30, round_plot = FALSE, plot_bg_fill = NA)
-
theme_jonohey_wiggle()will give you wiggly axis.
p + theme_axes_wiggle()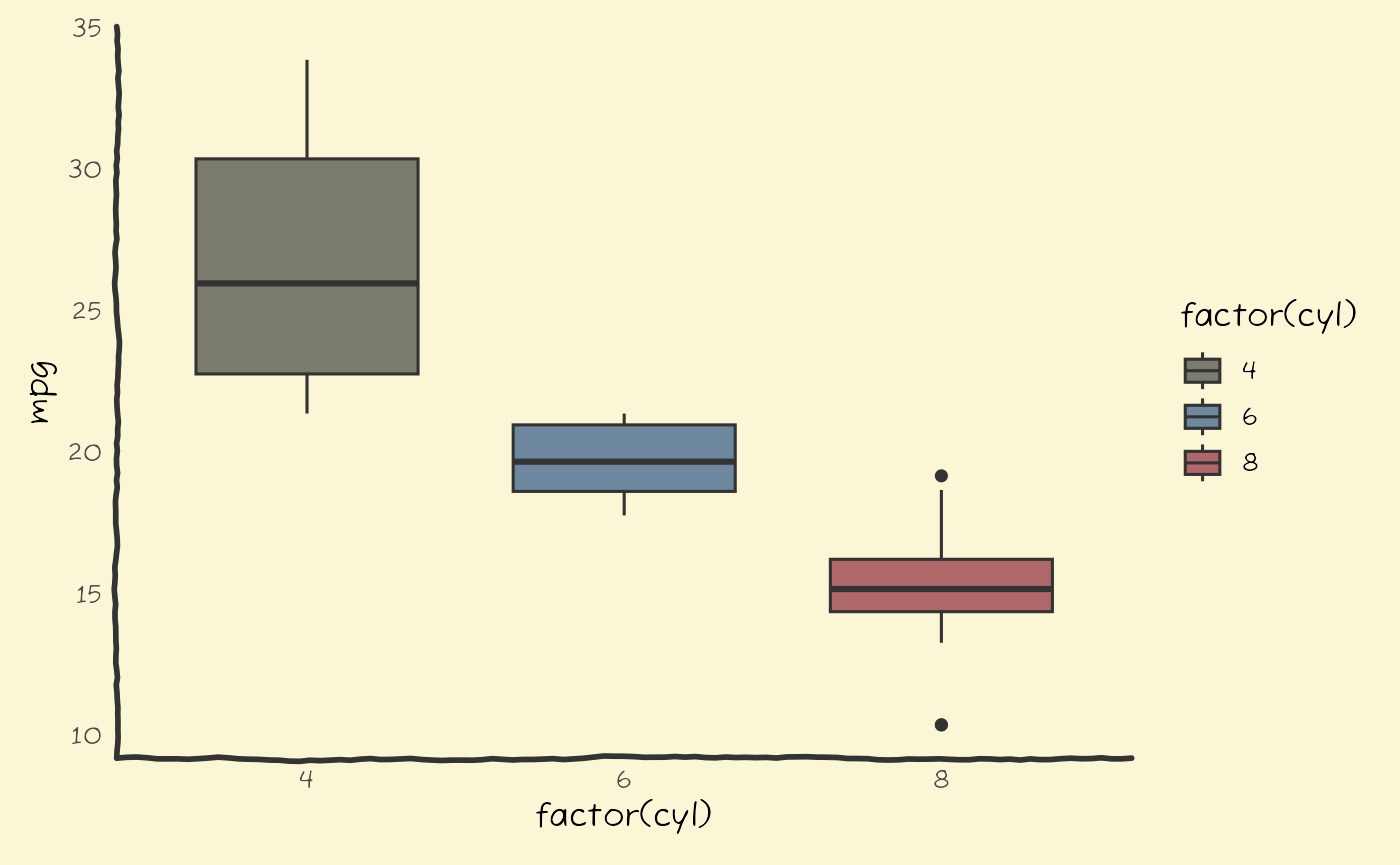
As of this version, we provide minimal wiggly configurations powered
by {elementalist}.
If you decide you need more grooves you can implement it yourself.
For example:
 p +
  theme_axes_wiggle() +
  theme(panel.grid.major = elementalist::element_line_wiggle(2,
                                                             color = "gray20",
                                                             linewidth = 0.2))